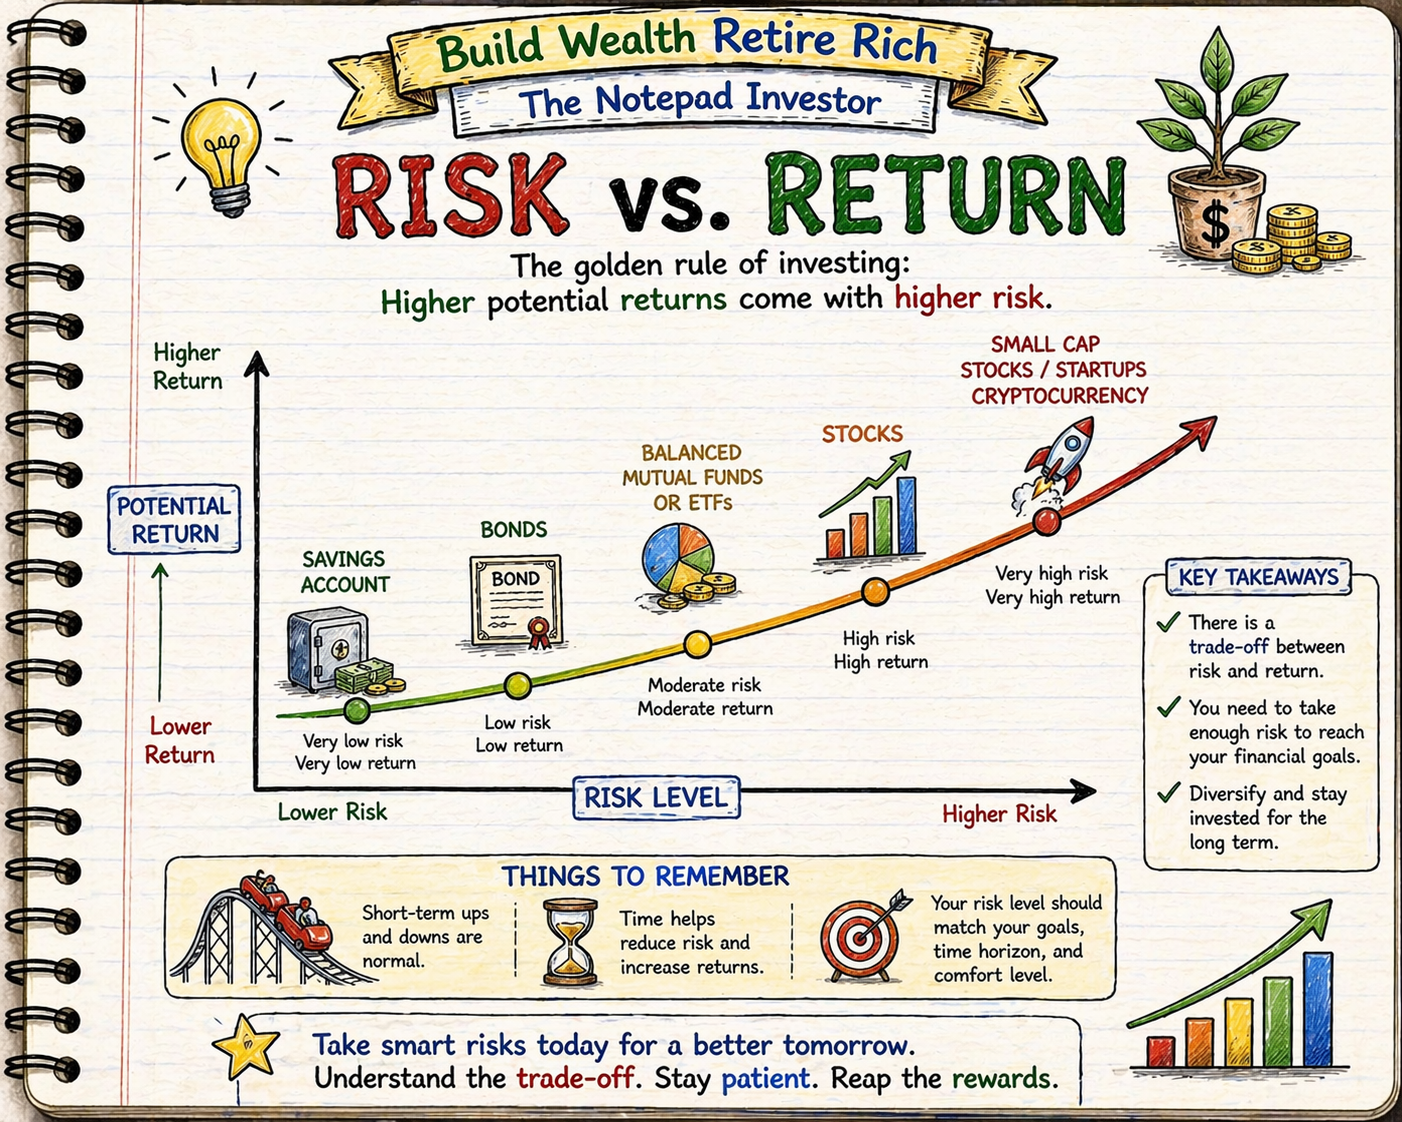
Risk versus return represents fundamental investing principle governing all financial markets—higher potential returns require accepting higher risk (volatility, loss potential, uncertainty), while lower risk investments provide correspondingly lower returns creating unavoidable trade-off where seeking 10-12% stock market gains demands tolerating 20-50% temporary portfolio declines, versus guaranteed 3-5% bond or savings returns eliminating volatility but sacrificing growth potential. Understanding this relationship prevents unrealistic expectations seeking high returns with zero risk (impossible outside fraud), enables informed asset allocation balancing growth needs against volatility tolerance, and explains why diversified portfolios combine multiple risk-return levels optimizing overall outcomes—stocks providing 8-12% average returns with high volatility for long-term growth, bonds offering 3-6% returns with moderate stability for balance, and cash/savings delivering 0.5-5% guaranteed returns for safety, creating strategic combinations achieving desired return targets while managing acceptable risk levels impossible when seeking single “perfect” investment providing both maximum returns and zero risk violating fundamental financial principles governing all legitimate securities.
This article is designed for investors confused about risk-return relationship, individuals seeking high returns while avoiding all risk creating unrealistic expectations, or those paralyzed by risk fear preventing any investing despite long timelines. You do not need advanced financial knowledge to understand risk-return—fundamental concept accessible through clear explanations of volatility, return ranges, and strategic allocation, though requires honest self-assessment determining personal risk tolerance beyond theoretical preference, realistic return expectations understanding 10% average includes negative years not guaranteed steady gains, and disciplined commitment maintaining chosen allocation through inevitable market downturns not abandoning strategy when experiencing first significant loss, making risk-return literacy requiring both intellectual understanding (mathematics, historical patterns, diversification benefits) and emotional preparation (volatility acceptance, panic resistance, long-term perspective) impossible when focusing solely on return potential without comprehensive risk assessment creating portfolio mismatches destroying wealth through forced liquidations or strategy abandonment during stress.
Understanding risk versus return matters because appropriate risk acceptance enables wealth-building returns impossible through zero-risk vehicles—8-10% stock returns creating $733,000 from $180,000 contributions over 30 years versus 2% safe returns yielding $246,000 demonstrating $487,000 wealth differential, while simultaneous risk management through diversification and timeline matching prevents catastrophic losses from excessive concentration or inappropriate short-term stock exposure, and realistic expectations prevent panic selling during inevitable 20-50% market crashes preserving compound growth—while risk-literate investors harness calculated volatility building $500,000-2,000,000 retirement wealth through disciplined long-term stock allocation despite temporary declines, versus risk-avoiders accumulating inadequate $200,000-400,000 inflation-eroded savings or risk-takers experiencing total losses through speculation and excessive concentration, demonstrating risk-return understanding as essential investment foundation enabling informed strategic positioning neither avoiding necessary growth risk nor accepting reckless speculation creating optimal balanced approach impossible without comprehensive relationship literacy.
Educational disclaimer: This article provides general educational information about investment risk and return concepts. Individual appropriate risk levels, asset allocations, and investment strategies vary significantly based on circumstances including age, income, financial goals, time horizon, and personal risk tolerance. This is not financial advice or investment recommendation. All investments carry risk including potential loss of principal. Past performance does not guarantee future results. Return ranges represent historical averages with significant volatility—actual results vary substantially. Consult qualified financial advisors for personalized guidance matching individual situations and risk tolerance.
The Risk-Return Spectrum
Understanding Investment Risk
What investment risk means:
- Volatility: Daily, monthly, annual price fluctuations creating temporary losses
- Market risk: Entire market declining 20-50% affecting all investments
- Specific risk: Individual company bankruptcy or poor performance
- Liquidity risk: Inability selling quickly without significant price concessions
- Inflation risk: Returns failing to keep pace with purchasing power erosion
- Opportunity risk: Tying money up preventing better alternatives
Risk types matter differently by timeline:
- Short-term (under 5 years): Volatility risk critical (may need money during downturn)
- Long-term (10+ years): Inflation risk critical (purchasing power preservation essential)
- Volatility becomes opportunity when timeline allows recovery
The Fundamental Principle
Core relationship: Higher returns require accepting higher risk
There is no “free lunch” in investing:
- Cannot achieve high returns without accepting high risk
- Cannot eliminate risk without accepting low returns
- Any investment promising high returns with zero risk = fraud or misunderstood risk
Why this relationship exists:
- Investors demand compensation (higher returns) for bearing risk
- Safe investments attract more buyers driving prices up and yields down
- Risky investments require return premiums attracting sufficient buyers
- Market competition ensures risk-return balance across all securities
Investment Spectrum from Low to High Risk
FDIC Savings Accounts (Lowest Risk):
- Expected return: 0.5-5% annually (varies with Fed rates)
- Risk: Virtually zero principal loss (FDIC insured $250,000)
- Volatility: None (stable balance)
- Best for: Emergency funds, short-term money under 2 years
Government Bonds (Very Low Risk):
- Expected return: 3-5% annually
- Risk: Minimal (backed by U.S. government)
- Volatility: Low (5-10% price fluctuations possible)
- Best for: Conservative portion of portfolio, capital preservation focus
Corporate Bonds (Low-Moderate Risk):
- Expected return: 4-7% annually
- Risk: Company default possible (though rare for investment-grade)
- Volatility: Moderate (10-15% fluctuations)
- Best for: Income generation, portfolio stability component
Balanced Funds 60/40 (Moderate Risk):
- Expected return: 6-8% annually
- Risk: Moderate market exposure with bond buffer
- Volatility: Moderate (15-25% drawdowns possible)
- Best for: Conservative investors, near-retirees, 5-15 year timelines
Stock Index Funds (Moderate-High Risk):
- Expected return: 8-12% annually average
- Risk: Significant temporary losses possible
- Volatility: High (20-50% market crashes periodic)
- Best for: Long-term wealth building 10+ years, retirement accounts
Individual Stocks (High Risk):
- Expected return: -100% to +1,000%+ (wide range)
- Risk: Company bankruptcy possible, concentration risk extreme
- Volatility: Very high (daily swings 5-20% common for volatile stocks)
- Best for: Experienced investors, small portfolio portions 5-10%
Speculative Investments (Very High Risk):
- Cryptocurrency, options, penny stocks, leveraged products
- Expected return: Unlimited upside/downside
- Risk: Total loss common, extreme volatility
- Volatility: Extreme (50-90% swings possible)
- Best for: Only small amounts can afford losing completely

Historical Risk-Return Data
Stock Market Returns and Volatility
Long-term average (1926-2025):
- Average annual return: 10.0%
- Best year: +54% (1933)
- Worst year: -43% (1931)
- Positive years: 74% (approximately 3 out of 4 years positive)
- Negative years: 26% (approximately 1 out of 4 years negative)
The volatility reality:
- 10% average does NOT mean 10% every year
- Annual returns range from -40% to +50% in individual years
- Multi-year periods show less variance than single years
- 20+ year periods virtually always positive despite interim crashes
Major market crashes (temporary but severe):
- Great Depression (1929-1932): -83% over 3 years, recovered by 1954
- 1973-1974: -48% over 2 years, recovered by 1982
- 2000-2002 Dot-com: -49% over 2.5 years, recovered by 2007
- 2008 Financial Crisis: -57% over 17 months, recovered by 2013
- 2020 COVID: -34% over 1 month, recovered in 5 months
Pattern: All crashes followed by recoveries and new highs
Bond Returns and Stability
Government bond historical performance:
- Average annual return: 5-6% long-term
- Best year: +32% (1982, falling interest rates)
- Worst year: -11% (2022, rising interest rates)
- Positive years: 85% (more consistent than stocks)
- Negative years: 15% (rare but possible)
Bond volatility characteristics:
- Typical annual fluctuation: 3-8%
- Extreme movements rare: 10-15% worst cases
- Much lower volatility than stocks but not zero
- Often (not always) provide stability during stock crashes
Rolling Period Return Analysis
Stocks (S&P 500) rolling returns:
- 1-year periods: 74% positive, 26% negative (range -43% to +54%)
- 5-year periods: 88% positive, 12% negative (range -12% to +29% annualized)
- 10-year periods: 94% positive, 6% negative (range -4% to +20% annualized)
- 20-year periods: 100% positive, 0% negative (range +6% to +18% annualized)
Key insight: Longer holding periods dramatically reduce loss probability
Time horizon impact on risk:
- 1 year: 26% chance losing money in stocks
- 5 years: 12% chance losing money
- 10 years: 6% chance losing money
- 20 years: 0% chance historically (though not guaranteed future)
Inflation-Adjusted (Real) Returns
After accounting for inflation (2-3% average):
- Stocks: 7-8% real return (10% nominal – 2.5% inflation)
- Bonds: 2-3% real return (5% nominal – 2.5% inflation)
- Savings: -1% to +2% real return (often negative after inflation)
Purchasing power growth comparison (30 years):
- $100,000 stocks at 7% real: $761,000 purchasing power
- $100,000 bonds at 2.5% real: $210,000 purchasing power
- $100,000 savings at 0% real: $100,000 purchasing power (no growth)
Balancing Risk and Return Through Allocation
Asset Allocation Determines Portfolio Risk-Return
Sample portfolio allocations and expected outcomes:
CONSERVATIVE (30% stocks, 70% bonds):
- Expected return: 5-6% annually
- Expected volatility: 10-15% typical drawdown
- Worst historical crash: -22% (2008)
- Recovery timeline: 1-2 years typical
- Appropriate for: Ages 60+, very risk-averse, short timelines 3-7 years
MODERATE (60% stocks, 40% bonds):
- Expected return: 7-8% annually
- Expected volatility: 15-25% typical drawdown
- Worst historical crash: -32% (2008)
- Recovery timeline: 2-3 years typical
- Appropriate for: Ages 45-65, moderate risk tolerance, 7-15 year timelines
GROWTH (80% stocks, 20% bonds):
- Expected return: 8-9% annually
- Expected volatility: 20-35% typical drawdown
- Worst historical crash: -43% (2008)
- Recovery timeline: 3-4 years typical
- Appropriate for: Ages 30-50, above-average risk tolerance, 10-20 year timelines
AGGRESSIVE (100% stocks):
- Expected return: 10-11% annually
- Expected volatility: 25-50% typical drawdown
- Worst historical crash: -57% (2008)
- Recovery timeline: 4-5 years typical
- Appropriate for: Ages 20-45, high risk tolerance, 15+ year timelines
Diversification Reduces Risk Without Sacrificing Returns
The diversification benefit:
- Single stock: 10% average return, 40-80% annual volatility, bankruptcy risk
- 10 stocks: 10% average return, 25-40% volatility, reduced bankruptcy impact
- 100+ stocks (index fund): 10% average return, 15-25% volatility, no single company risk
Same return, dramatically reduced risk through diversification
Asset class diversification:
- U.S. stocks + International stocks: Reduces geographic concentration
- Stocks + Bonds: Reduces overall volatility, bonds often stabilize during stock crashes
- Large companies + Small companies: Captures different growth patterns
- Growth + Value stocks: Different performance cycles balance portfolio
Historical diversification example (2008 crash):
- 100% U.S. stocks: -37% year
- 60% stocks, 40% bonds: -22% year
- 30% stocks, 70% bonds: -11% year
- Bonds buffered stock losses significantly
Age-Appropriate Risk Allocation
Rule of thumb: 110 minus age = stock allocation percentage
Ages 20-30 (Aggressive Growth):
- Suggested allocation: 90-100% stocks, 0-10% bonds
- Rationale: 35-45 years until retirement allows multiple crash recoveries
- Expected return: 9-10% annually
- Can tolerate 40-50% crashes knowing recovery certain with timeline
Ages 30-45 (Growth Focus):
- Suggested allocation: 80-90% stocks, 10-20% bonds
- Rationale: 20-35 years until retirement, peak earning years
- Expected return: 8-9% annually
- Slight stability from bonds, still aggressive growth priority
Ages 45-60 (Balanced Growth):
- Suggested allocation: 60-70% stocks, 30-40% bonds
- Rationale: 5-20 years until retirement, reducing volatility gradually
- Expected return: 7-8% annually
- Balance growth need with increasing stability priority
Ages 60-75 (Conservative Growth):
- Suggested allocation: 40-50% stocks, 50-60% bonds
- Rationale: In retirement or approaching, cannot afford major losses
- Expected return: 5-6% annually
- Capital preservation priority with modest growth
Ages 75+ (Capital Preservation):
- Suggested allocation: 20-30% stocks, 70-80% bonds/cash
- Rationale: Shorter life expectancy, stability critical
- Expected return: 3-5% annually
- Protecting principal while maintaining some inflation hedge
Managing Risk Appropriately
Risk Tolerance Assessment
Financial risk capacity (objective factors):
- Time horizon: Longer timeline = higher risk capacity
- Income stability: Stable employment = higher capacity
- Emergency fund: Adequate buffer = higher capacity
- Debt level: Low debt = higher capacity
- Dependents: Fewer obligations = higher capacity
Emotional risk tolerance (subjective factors):
- Sleep test: Can you sleep if portfolio drops 30%?
- Past behavior: Did you panic sell in 2020 COVID crash?
- Stress response: Does market volatility cause significant anxiety?
- Focus ability: Can you ignore daily market movements?
Risk tolerance scenarios:
Scenario A: High risk tolerance
- Age 28, stable tech job, $40,000 emergency fund, no debt
- 37 years until retirement, can increase income if needed
- Emotionally: Remained calm during 2020 crash, continued investing
- Appropriate allocation: 100% stocks (aggressive growth)
Scenario B: Moderate risk tolerance
- Age 52, stable career, $25,000 emergency fund, small mortgage
- 13 years until retirement, good savings rate
- Emotionally: Worried during crashes but didn’t sell
- Appropriate allocation: 60-70% stocks, 30-40% bonds (balanced)
Scenario C: Low risk tolerance
- Age 42, commission-based income, $10,000 emergency fund, high expenses
- 23 years until retirement but income volatile
- Emotionally: Extreme stress during market declines, sold in 2020
- Appropriate allocation: 40-50% stocks, 50-60% bonds (conservative despite age)
Key: Choose allocation you can maintain through crashes, not theoretical optimum
Common Risk Management Mistakes
Mistake 1: Taking inappropriate risk for timeline
- Example: 100% stocks for money needed in 3 years
- Risk: Market crashes right before need, insufficient time recovery
- Result: Forced to sell at loss or delay major goals
- Correction: Match allocation to timeline (under 5 years = conservative)
Mistake 2: Avoiding necessary risk for long timeline
- Example: 100% bonds at age 30 for retirement age 65
- Risk: Insufficient growth, inflation erodes purchasing power
- Result: Inadequate retirement savings despite 35-year contribution period
- Correction: Accept appropriate volatility for 30+ year timeline
Mistake 3: Panic selling during downturns
- Example: Portfolio drops 30%, sell everything “protecting remaining capital”
- Risk: Lock in losses, miss recovery, poor future timing
- Result: Permanent loss from temporary decline
- Correction: Maintain allocation through volatility, continued contributions
Mistake 4: Concentration risk (all eggs one basket)
- Example: $100,000 in single company stock
- Risk: Company bankruptcy, industry disruption, poor management
- Result: Total or near-total loss possible (Enron, Lehman Brothers, etc.)
- Correction: Diversify across hundreds/thousands of companies via index funds
Mistake 5: Chasing returns without understanding risk
- Example: Invest in cryptocurrency promising 1,000% returns
- Risk: Extreme volatility, fraud, total loss
- Result: 50-90% losses common, many lose entire investment
- Correction: Understand risk before investing, limit speculative positions 5% portfolio maximum
Risk Mitigation Strategies
Dollar-cost averaging (DCA):
- Invest fixed amount regularly regardless of market level
- Buys more shares when prices low, fewer when high
- Reduces timing risk, averages purchase price over time
- Example: $500 monthly buys 5 shares at $100, 10 shares at $50, averaging better price
Rebalancing:
- Periodically restore target allocation (annually or when drift 5%+)
- Sells winners, buys losers maintaining risk level
- Example: Target 70/30 stocks/bonds drifts to 80/20 after stock gains, sell 10% stocks buying bonds
- Forces discipline selling high and buying low
Emergency fund buffer:
- 3-6 months expenses in cash prevents forced investment liquidation
- Allows riding out market crashes without selling
- Enables continued investing during downturns
Gradual allocation shifts:
- Reduce stock percentage gradually approaching retirement
- Age 50: Start shifting 1-2% annually from stocks to bonds
- Age 65: Continue gradual shift protecting accumulated wealth
- Avoids sudden allocation changes creating timing risk
Expected Returns by Risk Level
Conservative Portfolio (30/70 stocks/bonds)
30-year projection: $500 monthly investment
- Expected return: 5.5% annually
- Total contributed: $180,000
- Expected final value: $448,000
- Gain: $268,000 (149% of contributions)
- Worst historical 30-year: $380,000 (still positive)
- Best historical 30-year: $520,000
Volatility experience:
- Typical drawdown: -15% (portfolio $100K drops to $85K temporarily)
- Recovery time: 1-2 years
- Sleep quality: Good (low stress from stability)
Moderate Portfolio (60/40 stocks/bonds)
30-year projection: $500 monthly investment
- Expected return: 7.5% annually
- Total contributed: $180,000
- Expected final value: $631,000
- Gain: $451,000 (251% of contributions)
- Worst historical 30-year: $495,000
- Best historical 30-year: $780,000
Volatility experience:
- Typical drawdown: -25% (portfolio $100K drops to $75K temporarily)
- Recovery time: 2-3 years
- Sleep quality: Fair (moderate stress during crashes)
Aggressive Portfolio (100% stocks)
30-year projection: $500 monthly investment
- Expected return: 10% annually
- Total contributed: $180,000
- Expected final value: $1,028,000
- Gain: $848,000 (471% of contributions)
- Worst historical 30-year: $720,000
- Best historical 30-year: $1,450,000
Volatility experience:
- Typical drawdown: -40% (portfolio $100K drops to $60K temporarily)
- Recovery time: 3-5 years
- Sleep quality: Poor-to-fair (high stress during crashes requiring discipline)
Risk-Return Trade-Off Comparison
Conservative vs Aggressive (30-year outcome):
- Aggressive advantage: $580,000 higher expected value ($1,028K vs $448K)
- Conservative advantage: -15% drawdowns versus -40% (62% less stress)
- Moderate middle ground: $631,000 outcome, -25% drawdowns (balanced)
Key decision: Is $580,000 extra wealth worth tolerating -40% temporary losses?
- Age 30 with 35-year timeline: Usually yes (time allows recovery)
- Age 60 with 10-year timeline: Usually no (insufficient recovery time)
- Personal: Depends on emotional tolerance and financial capacity
Why Understanding Risk vs Return Matters
Without understanding risk-return relationship, investors either avoid necessary risk keeping retirement money in 2-5% savings losing $500,000-700,000 compound growth potential creating retirement inadequacy, or accept inappropriate excessive risk pursuing 20%+ returns through speculation losing substantial capital through volatility and concentration creating permanent wealth destruction, missing strategic balance accepting calculated risk for long-term growth while managing volatility through diversification and timeline matching—while risk-literate investors harness 8-10% stock returns building $500,000-2,000,000 retirement wealth through disciplined long-term allocation despite tolerating temporary 20-40% declines knowing recovery certain with 20-30 year timelines, versus risk-avoiders accumulating inadequate $200,000-400,000 or risk-takers experiencing catastrophic losses from speculation and poor timing, demonstrating risk-return understanding as essential investment foundation enabling informed strategic positioning neither avoiding necessary growth risk nor accepting reckless speculation creating optimal balanced approach impossible without comprehensive relationship literacy recognizing fundamental principle that higher returns require accepting higher risk with no exceptions in legitimate investing.
Understanding risk versus return enables individuals to:
- Accept necessary volatility for long-term growth recognizing 20-40% drawdowns temporary not permanent
- Match risk level to timeline appropriately (aggressive long-term, conservative short-term)
- Set realistic return expectations understanding 10% average includes negative years
- Diversify reducing risk without sacrificing returns through broad index funds
- Maintain discipline through inevitable crashes preventing panic selling
- Assess personal risk tolerance honestly choosing sustainable allocation
- Avoid fraudulent “high returns, zero risk” schemes violating fundamental principles
Risk-return knowledge transforms investing from fear-driven cash hoarding or greed-driven speculation into informed strategic allocation balancing growth needs against volatility tolerance, enabling wealth building through calculated risk acceptance impossible for extreme-approach users creating either inadequate savings or catastrophic speculation losses.
Common Misunderstandings
Many people believe risk can be completely eliminated through careful investment selection or timing finding “safe” stocks providing high returns. In reality, all investments carrying significant returns necessarily include significant risk with no exceptions—10% returns require accepting 20-40% temporary losses, guaranteed 3-5% returns provide stability but sacrifice growth, and any promise of “high returns, zero risk” indicates fraud or misunderstood risk (like cryptocurrency volatility not perceived as risk until experiencing 70% crash), proving fundamental risk-return relationship unavoidable in legitimate investing making risk acceptance essential for wealth building not defect to overcome through superior strategy or timing skill.
Another common misconception is diversification eliminates investment risk making diversified portfolios “safe” despite stock allocation. However, diversification reduces specific company risk (bankruptcy, poor management) but cannot eliminate market risk affecting all stocks simultaneously—2008 crash dropped diversified index funds 50-57% despite containing thousands of companies proving systematic market risk unavoidable through diversification, though diversification does reduce volatility versus individual stocks (index -50% versus some individuals -90% or -100%) making diversification essential risk management tool not risk elimination achieving 10% returns with lower volatility than concentrated positions but still requiring market crash tolerance impossible to diversify away completely.
Some believe past returns guarantee future performance making historical 10% stock average ensuring 10% personally. However, individual investor experiences vary dramatically from market averages through poor timing, panic selling, excessive fees, and behavioral mistakes—studies show average investor returns 3-4% annually versus market 10% from buying high selling low pattern and excessive trading, proving market returns achievable only through disciplined buy-and-hold approach matching market timeline while individual timing attempts typically underperform creating return gap between theoretical market performance and actual investor outcomes making discipline and long-term holding essential capturing advertised returns not automatically achieved through market participation alone.
How Risk-Return Understanding Fits Into Financial Success
Risk-return understanding enables wealth maximization through appropriate risk acceptance for timeline—aggressive stock allocation ages 25-50 harnessing 8-10% returns building $500,000-2,000,000 retirement wealth despite tolerating temporary 30-50% declines knowing 20-40 year recovery timeline certain, versus inappropriate excessive caution keeping retirement money in 2-5% savings creating $200,000-400,000 inadequate accumulation from fear-driven risk avoidance, while simultaneous risk management through diversification, timeline matching, and volatility acceptance prevents catastrophic losses from speculation or panic selling—making risk-return literacy essential requiring honest assessment determining sustainable allocation (can maintain through crashes not abandon), realistic expectations understanding volatility inevitable not defective strategy, and disciplined commitment holding through downturns capturing long-term average returns impossible for panic sellers locking in temporary losses, transforming investing from fear or greed extremes into informed strategic positioning balancing growth needs against volatility tolerance creating optimal outcomes impossible without comprehensive relationship understanding.
For example, two individuals both age 30 beginning retirement investing with $500 monthly capacity over 35 years. Person A fears market risk from hearing crash stories, chooses “safe” conservative bond allocation 20% stocks 80% bonds minimizing volatility. Age 30-65: Invests $500 monthly consistently, experiences minimal stress during market crashes (portfolio only drops 10-15% versus 40-50% stock portfolios), feels secure from stability, never panic sells maintaining discipline easily. Age 65: Contributed $210,000 total ($500 × 12 × 35), portfolio value $520,000 at 5.5% conservative returns. Retirement income: $1,730 monthly (4% withdrawal), combined Social Security $2,200 = $3,930 total requiring lifestyle reduction from $5,000 working years, modest retirement forcing budget consciousness, cannot help children substantially, outlives savings age 85 requiring sole Social Security. Person B understands risk-return relationship, recognizes 35-year timeline allows multiple crash recoveries accepting volatility for growth, chooses appropriate aggressive allocation 100% stocks. Age 30-45: Invests $500 monthly, experiences first major crash age 38 dropping portfolio from $65,000 to $40,000 (38% decline), feels uncomfortable but understands temporary, continues $500 monthly buying discounted shares, portfolio recovers to $70,000 by age 42 then $140,000 age 45 demonstrating recovery pattern. Age 45-55: Second major crash age 52 dropping $380,000 portfolio to $240,000 (37% decline), experiences significant stress watching $140,000 “disappear,” reviews risk-return understanding and 13-year remaining timeline, maintains discipline continuing contributions, recovers to $420,000 age 55 reinforcing pattern. Age 55-65: Final decade smoother with normal 10-20% fluctuations, portfolio grows from $650,000 to $1,028,000 through continued contributions and compound returns. Age 65: Contributed $210,000 same as Person A, portfolio value $1,028,000 at 10% aggressive returns demonstrating risk acceptance reward. Retirement income: $3,430 monthly (4% withdrawal from $1,028,000), combined Social Security $2,200 = $5,630 total exceeding working years enabling comfortable lifestyle, helps grandchildren education $100,000 without impacting security, leaves $650,000 inheritance demonstrating generational wealth. Difference: Person A’s excessive risk avoidance created $520,000 forcing lifestyle reduction despite 35-year discipline, Person B’s appropriate risk acceptance created $1,028,000 (1.98x higher) from identical contributions through understanding volatility temporary when timeline adequate demonstrating $508,000 wealth differential plus $1,700 monthly additional retirement income ($5,630 versus $3,930) from accepting calculated risk tolerating two 35-40% crashes during 35-year journey knowing recovery certain impossible when fear-driven excessive caution prevents necessary growth risk despite adequate timeline or greed-driven speculation creating losses through concentration and poor timing.
Risk-return understanding separates wealthy disciplined investors from fearful under-accumulators or reckless speculators, requiring honest tolerance assessment, timeline-appropriate allocation, and crash discipline creating measurable prosperity differences impossible without fundamental relationship literacy.
Recent Updates and Trends
In recent years, market volatility has intensified through technology-driven rapid information flow creating sharper faster price movements with 20-30% corrections occurring more frequently, though fundamental risk-return relationship unchanged with long-term returns still averaging 8-10% despite increased short-term turbulence making volatility acceptance even more critical while patient long-term approach produces identical wealth-building outcomes regardless of intra-year volatility magnitude when maintaining multi-decade holding periods.
Zero-commission trading and fractional shares have democratized investing access enabling smaller investors participating in diversified portfolios, though simultaneously tempting excessive trading and speculation when easy access combined with gamification features creating behavioral risks destroying wealth through poor timing despite technological accessibility improvements making discipline more important than ever when transaction friction removed.
Cryptocurrency emergence promised high returns attracting speculative capital experiencing extreme volatility with 50-80% crashes common, though reinforcing fundamental risk-return principle when many investors lost substantial capital learning “high returns require high risk” through painful experience proving timeless relationship applies universally including newer asset classes not exempt from fundamental principles governing all securities.
Index fund proliferation through low-cost providers (Vanguard, Fidelity, Schwab) offering 0.03-0.15% expense ratios has enabled optimal diversification reducing risk without sacrificing returns, though investor behavior still determines outcomes when access to optimal tools insufficient without discipline maintaining allocation through volatility making product improvements enhancing but not replacing fundamental investor commitment requirements.
Fundamental risk-return principles remain timeless: higher returns require accepting higher risk without exceptions in legitimate investing, long-term timelines (20+ years) dramatically reduce loss probability making temporary volatility acceptable, diversification reduces specific risk without eliminating market risk, and personal risk tolerance determines sustainable allocation more important than theoretical optimum—regardless of volatility changes, zero-commission trading, cryptocurrency emergence, or index fund proliferation, understanding calculated risk acceptance for growth while managing volatility through diversification and timeline matching produces wealth-building success impossible through fear-driven excessive caution or greed-driven speculation violating fundamental relationship governing all financial markets.
3 Things You Can Do Today
Ready to balance risk and return strategically? Here are three simple steps you can take right now:
1. Assess personal risk tolerance honestly determining sustainable allocation matching emotional capacity not theoretical optimum – Financial capacity assessment: Age and timeline (years until need money determines recovery time from crashes), emergency fund status ($15,000+ adequate provides buffer enabling investment risk), income stability (secure employment versus volatile commission), debt level (low debt increases risk capacity). Example financial assessment: Age 35, retirement age 65 = 30-year timeline (high capacity), $20,000 emergency fund (adequate), stable salary (high capacity), no debt (high capacity) = High financial risk capacity appropriate 80-100% stocks. Emotional tolerance evaluation: Past behavior (did you panic sell in 2020 COVID crash or maintain discipline?), stress response (how would you react to portfolio dropping from $100,000 to $60,000 over 6 months?), monitoring frequency (can you avoid checking portfolio daily or would drops cause anxiety?), sleep test (could you sleep comfortably knowing portfolio down 30% temporarily?). Example emotional assessment: Remained invested through 2020 (positive), would feel stressed but not panic at -40% (moderate), checks portfolio weekly causing anxiety (negative), would lose sleep over large drops (negative) = Moderate emotional tolerance suggesting 60-70% stocks despite high financial capacity. Combined allocation determination: Financial capacity = aggressive (100% stocks), emotional tolerance = moderate (60-70% stocks), appropriate allocation = 70% stocks balancing both factors (can maintain through stress without abandoning strategy). Alternative scenarios: High financial + High emotional = 90-100% stocks maximizing growth, High financial + Low emotional = 50-60% stocks matching sustainable tolerance, Low financial + High emotional = 40-50% stocks respecting timeline constraints. Write assessment: “Financial capacity: High (30-year timeline, adequate emergency fund, stable income, no debt). Emotional tolerance: Moderate (maintained 2020 but stressed, would struggle with -40%). Appropriate allocation: 70% stocks, 30% bonds (balancing capacity with sustainable tolerance).” Takes 20 minutes creating honest evaluation preventing allocation mismatch where theoretical optimal portfolio (100% stocks age 35) abandoned during first major crash from emotional intolerance destroying wealth through panic selling impossible when choosing sustainable allocation maintaining through inevitable volatility.
2. Calculate expected returns and volatility for chosen allocation understanding realistic outcomes – Determine target allocation from risk assessment: Example 70% stocks, 30% bonds. Expected return calculation: (Stock allocation × stock return) + (Bond allocation × bond return) = expected portfolio return. Example: (0.70 × 10%) + (0.30 × 5%) = 7% + 1.5% = 8.5% expected annual return. 30-year wealth projection: Use investment calculator entering monthly contribution, expected return, timeline. Example: $600 monthly, 8.5% return, 30 years = $909,000 final value ($216,000 contributed, $693,000 gains). Volatility expectation: Historical drawdowns by allocation—100% stocks -50%, 80/20 -40%, 70/30 -32%, 60/40 -28%, 50/50 -22%. Example: 70/30 allocation expect -30 to -35% worst-case drawdown. Dollar impact understanding: Apply drawdown to future portfolio value determining emotional preparedness. Example: $300,000 portfolio at age 50 experiencing -32% crash = drops to $204,000 ($96,000 “lost” temporarily), recovery to $300,000 requires 2-3 years, can you maintain discipline during this scenario? Range of outcomes calculation: Best case (historical top 10%), expected case (historical average), worst case (historical bottom 10%). Example 70/30 allocation 30 years: Best $1,150,000, Expected $909,000, Worst $720,000 providing outcome range understanding. Comparison to alternative allocations: Conservative 40/60 = $560,000 expected (saving $349,000 stress but costing $349,000 wealth), Aggressive 100/0 = $1,028,000 expected (gaining $119,000 wealth but accepting -50% drawdowns). Write projections: “Allocation: 70% stocks, 30% bonds. Expected return: 8.5% annually. 30-year outcome: $909,000 ($600 monthly). Expected drawdown: -32% ($300K portfolio drops to $204K temporarily). Worst case 30-year: $720,000 (still substantial). Acceptable trade-off: Yes, balancing growth and volatility.” Takes 30 minutes creating realistic expectations preventing disappointment from misunderstanding volatility or abandonment from unexpected crashes impossible when entering investment journey with clear outcome projections and drawdown preparedness.
3. Implement diversified allocation matching determined risk level through low-cost index funds with automatic contributions – Account setup: Open or utilize existing Roth IRA, 401k, or taxable brokerage at Vanguard, Fidelity, or Schwab. Fund selection based on allocation: Example 70% stocks, 30% bonds implementation options—Option A Simple: 70% total stock market index (VTSAX/FSKAX/SWTSX), 30% total bond index (VBTLX/FXNAX/SWAGX). Option B Detailed: 50% U.S. stocks (VTI/ITOT), 20% international stocks (VXUS/IXUS), 30% bonds (BND/AGG) creating enhanced diversification. Automatic contribution setup: Schedule automatic monthly investment matching risk assessment allocation. Example: $600 monthly total = $420 stock fund automatic, $180 bond fund automatic (70/30 split), executes regardless of market conditions preventing timing attempts. Purchase execution: Initial investment using Option A Simple—$5,000 available, buy $3,500 stock index, $1,500 bond index immediately (70/30), set up $600 monthly ongoing. Rebalancing plan: Annual review checking allocation drift, if stocks grow to 80% from gains, sell 10% buying bonds restoring 70/30 target, maintains risk level through market cycles. Commitment pledge: “I commit to maintaining 70/30 allocation for minimum 5 years regardless of market movements, will not panic sell during crashes, will continue automatic contributions especially during downturns, will rebalance annually only.” Behavioral preparation: Expect portfolio value fluctuating daily (-2% to +2%), monthly (-10% to +10%), annually potentially -30%+ some years or +40%+ others, 3-5 year periods likely recovering from crashes to new highs reinforcing long-term perspective. Comparison to current approach: If currently 100% savings earning 4%, shifting to 70/30 invested increases expected wealth $909,000 versus $350,000 savings demonstrating $559,000 benefit from appropriate risk acceptance over 30 years. Write implementation: “Allocation: 70% VTSAX, 30% VBTLX. Automatic: $420 VTSAX + $180 VBTLX monthly. Rebalance: Annually if drift 5%+. Commitment: Maintain through volatility minimum 5 years, continue contributions during crashes.” Takes 60-90 minutes implementing strategic allocation transforming from theoretical risk assessment into actual diversified portfolio with systematic contributions impossible when perpetually analyzing without execution or investing without allocation framework creating random positioning versus intentional balanced approach matching risk tolerance and timeline requirements.
These actions create risk-appropriate investment foundation within 2-3 hours—honest risk assessment determining sustainable 70/30 allocation matching emotional tolerance and financial capacity, calculated expected outcomes understanding $909,000 projection with -32% worst drawdown preparedness, and implemented diversified portfolio with automatic contributions preventing market timing while maintaining disciplined allocation—transforming from vague “should invest” or “stocks too risky” into informed strategic position balancing growth needs against volatility acceptance impossible without comprehensive risk-return understanding enabling wealth building through calculated discipline.
Quick FAQ
What’s the relationship between risk and return in investing?
Higher potential returns require accepting higher risk (volatility, loss potential) with unavoidable trade-off where no legitimate investment provides both high returns and zero risk: Fundamental principle—Market competition ensures risky investments offering higher returns attracting sufficient buyers while safe investments accepting lower returns from demand-driven price increases making relationship mandatory not negotiable across all securities. Return expectations by risk—Savings 0.5-5% virtually zero risk, government bonds 3-5% minimal risk, corporate bonds 4-7% low risk, balanced portfolios 6-8% moderate risk, stock index funds 8-12% moderate-high risk, individual stocks -100% to +1,000% high risk, speculation unlimited upside/downside extreme risk. Historical data confirmation—100 years market history shows consistent pattern: safest assets lowest returns (savings/T-bills), riskiest assets highest returns (stocks/ventures), with proportional relationship between volatility and average gains proving principle empirically not just theoretically. Timeline impact on relationship—Short timelines (under 5 years) make volatility catastrophic risk requiring safety despite low returns, long timelines (20+ years) make volatility manageable temporary fluctuation enabling risk acceptance for growth making relationship timeline-dependent not absolute. No exceptions rule—Any investment promising high returns (10%+) with guaranteed safety indicates fraud (Ponzi scheme), misunderstood risk (cryptocurrency volatility not perceived until crash), or temporary mispricing correcting quickly making skepticism essential when relationship appears violated. Key: Cannot achieve 10%+ returns without accepting 20-50% temporary losses, cannot eliminate volatility without accepting 2-5% returns making strategic choice determining which trade-off acceptable based on timeline, goals, and tolerance not finding magical exception violating fundamental market principles.
How much risk should I take based on my age?
General guideline: 110 minus age equals stock allocation percentage with remaining in bonds, though adjust based on personal risk tolerance and timeline: Age-based framework—Ages 20-35: 90-100% stocks (35-45 years until retirement allows multiple crash recoveries), Ages 35-50: 70-90% stocks (20-30 years sufficient recovery time), Ages 50-65: 50-70% stocks (approaching retirement requiring stability increase), Ages 65+: 30-50% stocks (in retirement protecting capital while maintaining inflation hedge). Rationale for age rule—Longer timeline until needing money allows tolerating temporary 30-50% losses knowing recovery within 3-5 years historically, shorter timeline cannot risk major loss near withdrawal creating forced selling at bottom making stability priority even at cost of lower returns. Personal adjustments to rule—High risk tolerance: Add 10-20% to stock allocation (age 40 might use 80% instead of 70%), Low risk tolerance: Subtract 10-20% from stocks (age 40 might use 50% instead of 70%), Very stable employment/pension: Can maintain higher stocks, Volatile income: Reduce stocks for stability. Timeline considerations beyond age—Retiring early age 50: Use age 65+ allocation despite chronological age 50, Retiring late age 70: Can maintain higher stocks through 60s, Needing money soon: Override age formula with conservative allocation regardless of age. Example decisions—Age 30 aggressive temperament: 100% stocks (maximum growth 35-year timeline), Age 30 conservative temperament: 70% stocks (reduced from 90% matching tolerance), Age 55 still working to 70: 75% stocks (treating as age 40 timeline-wise), Age 60 retired already: 40% stocks (capital preservation despite younger than typical retiree). Key: Age formula provides starting point not absolute rule, adjust based on actual timeline to withdrawal, personal risk tolerance (emotional capacity maintaining allocation through crashes), and income stability creating customized appropriate allocation impossible following rigid age-only formula ignoring individual circumstances.
Can I get high returns without high risk?
NO—fundamental impossibility in legitimate investing where high returns necessarily require high risk with no exceptions making promises otherwise indicating fraud or misunderstood risk: Why relationship unavoidable—If high-return low-risk investment existed, everyone would buy driving price up and returns down until risk-return balance restored, market competition ensures no “free lunch” exists for extended periods making permanent exceptions impossible. Common misconceptions creating false belief—”Real estate always goes up” ignores 2008 crash 40% declines, “Diversification eliminates risk” reduces but not eliminates still experiencing market crashes, “This company is safe” ignores bankruptcies (General Motors, Lehman Brothers, Enron), “Dollar-cost averaging removes risk” reduces timing risk not market risk still experiencing volatility. Maximum realistic returns by risk level—Guaranteed safety (FDIC savings): 0.5-5% maximum, Minimal risk (government bonds): 3-5% maximum, Low risk (corporate bonds): 4-7% maximum, Moderate risk (60/40 portfolio): 6-8% realistic, Moderate-high risk (stocks): 8-12% long-term average, High risk (individual stocks/speculation): Unlimited upside but 50%+ loss probability. Fraud indicators violating relationship—Promises 15%+ returns with guaranteed principal = Ponzi scheme, “Can’t lose” investments = misrepresenting risk, Consistent returns every month = fabricated not real market exposure, Pressure to invest quickly = preventing due diligence discovering fraud. Diversification benefit clarification—Reduces risk for SAME return not increases return for same risk, example: single stock 10% return 60% volatility versus index fund 10% return 20% volatility (same return, lower risk through diversification but still requires risk tolerance), doesn’t create 10% return with zero risk impossible outcome. Appropriate strategies within principle—Accept 8-10% returns tolerating 20-40% temporary losses (stock investing), Accept 4-6% returns minimizing volatility (bond investing), Accept 2-5% guaranteed returns eliminating loss risk (savings), each legitimate trade-off within fundamental relationship not circumventing principle. Key: Any promise of 10%+ returns without significant volatility indicates fraud, misunderstanding, or temporary situation correcting shortly making healthy skepticism essential protecting wealth from schemes violating fundamental market principles governing all legitimate securities universally without exceptions.
What should I do when my portfolio drops significantly?
Maintain position continuing regular contributions buying discounted shares, resist panic selling which locks in temporary losses preventing recovery participation: Crash response framework—Do NOTHING immediately (avoid emotional decisions during peak fear), review original timeline (20+ years until retirement = plenty of recovery time), check emergency fund adequacy (3-6 months expenses ensures no forced selling), continue automatic contributions (buying shares 30-50% cheaper than previous months). Historical pattern reassurance—Every significant crash (1929, 1973, 2000, 2008, 2020) followed by full recovery within 1-5 years and new all-time highs within 3-7 years proving temporary nature despite feeling permanent during downturn, patient holders recovered and prospered while panic sellers locked in permanent losses missing recovery. Dollar-cost averaging benefit during crashes—Monthly contributions buy more shares when prices low creating superior long-term returns, example: $500 monthly buys 5 shares at $100 pre-crash, buys 10 shares at $50 during crash, averaging $66 per share when recovery to $100 generates 50% gain versus 0% if stopped contributions. Avoid these mistakes—Selling at bottom locking in losses, stopping contributions missing discounted accumulation, checking portfolio daily amplifying emotional stress, making major allocation changes during fear peak, timing recovery attempting perfect re-entry (impossible consistently). When selling appropriate—Need money immediately for emergency AND emergency fund depleted (forced sale unavoidable), retiring within 1-2 years making recovery timeline insufficient (should have shifted to bonds earlier preventing this scenario), genuinely cannot sleep or function creating health crisis (allocation too aggressive for tolerance). Rebalancing opportunity—If allocation drifted significantly (80/20 target became 65/35 after stock crash), selling bonds buying stocks during downturn restores target while buying low creating future gains, systematic not emotional decision based on predetermined targets. Recovery timeline expectations—Moderate crashes (-20 to -30%): 1-2 year recovery typical, Severe crashes (-40 to -50%): 3-5 year recovery historical pattern, Continue contributions throughout earning superior returns versus stopping or selling. Write commitment reviewing during crashes: “Market crashes temporary not permanent, my timeline [X years] allows full recovery, I will maintain allocation and continue contributions buying discounted shares, I will not check portfolio more than quarterly during volatility, past crashes always recovered creating new highs rewarding patient disciplined investors.” Key: Worst action selling during crash locking in temporary loss, best action maintaining contributions buying discounted shares creating superior long-term returns impossible when panic-driven decisions override disciplined strategy during inevitable volatility.
Is it safer to invest in bonds than stocks?
Depends on timeline and risk definition—bonds safer short-term (lower volatility, capital preservation) but stocks safer long-term (inflation protection, purchasing power growth) making “safety” timeline-dependent: Short-term safety (under 5 years)—Bonds safer providing predictable returns and lower volatility, example: need $30,000 in 3 years, bonds earning 4-5% ensure availability versus stocks risking -30% crash right before need creating insufficiency forcing delay or goal abandonment. Long-term safety (20+ years)—Stocks safer providing inflation protection and purchasing power growth, example: $200,000 in bonds 30 years at 4% = $648,000 nominal but inflation erodes to $468,000 real purchasing power versus stocks at 10% = $3,487,000 nominal and $2,500,000 real demonstrating stocks protecting and growing purchasing power while bonds barely maintain. Volatility versus purchasing power trade-off—Bonds minimize year-to-year fluctuation but accept inflation erosion “safe” month-to-month, Stocks maximize long-term growth but accept temporary 20-50% declines “unsafe” short-term but safe long-term through purchasing power protection. Historical loss probability by timeline—Stocks 1-year period: 26% chance losing money, Stocks 20-year period: 0% chance losing money historically (100% positive despite interim crashes), Bonds 1-year: 15% chance loss, Bonds 20-year: 5% chance loss, demonstrating stocks becoming “safer” with longer timeline through loss probability reduction. Appropriate allocation framework—Money needed under 5 years: Bonds/savings safer (capital preservation priority), Money needed 5-10 years: Balanced safer (moderate growth with stability), Money needed 10+ years: Stocks safer (purchasing power growth essential), matching vehicle to timeline creating appropriate “safety” definition. Retirement phase consideration—Early retirement (65-75): Maintain 40-50% stocks “safer” protecting 20-30 year purchasing power, Late retirement (75+): Shift to bonds “safer” preserving capital over shorter timeline, showing definition evolving through life stages. Key: “Safer” depends entirely on timeline and whether prioritizing volatility minimization (bonds) or purchasing power protection (stocks) making question unanswerable without timeline context creating different appropriate vehicles for different timeframes.
Explore More in Investing Basics
Disclosure
This article provides general educational information about investment risk and return concepts and relationships. Individual appropriate risk levels, asset allocations, investment strategies, and outcomes vary significantly based on personal circumstances including age, income, financial goals, time horizon, risk tolerance, financial obligations, employment stability, and numerous other factors. This is not financial advice, investment recommendation, or guarantee of returns or outcomes. All investments carry risk including potential loss of principal invested. Past performance does not guarantee future results and should not be sole basis for investment decisions. Return ranges and historical data represent market averages over extended periods—individual experiences vary substantially and include significant year-to-year volatility with negative years occurring regularly. Worst-case scenarios and recovery timelines based on historical patterns—future market behavior may differ significantly from past performance. Stock market 10% average annual return includes significant volatility with individual years ranging -40% to +50%—actual investor returns often lower due to behavioral mistakes, poor timing, and fees. Bond returns subject to interest rate changes, credit risk, and inflation—not risk-free despite lower volatility than stocks. Risk tolerance assessments represent general frameworks not personalized psychological evaluations—individual emotional responses to volatility vary unpredictably until experienced. Age-based allocation guidelines represent general rules of thumb not personalized recommendations—individual circumstances warrant different approaches. Diversification reduces but does not eliminate market risk—diversified portfolios still experience significant losses during market crashes. Dollar-cost averaging does not guarantee profits or prevent losses—simply averages purchase price over time. Rebalancing may have tax consequences in taxable accounts. Portfolio allocation examples represent illustrative scenarios not specific recommendations. Crash recovery timelines based on historical patterns—future recoveries may take longer or shorter periods. Emergency fund recommendations represent general guidelines not personalized assessments. Fraud identification indicators represent common patterns—sophisticated fraud may appear legitimate requiring professional due diligence. Regulatory and tax implications vary by jurisdiction and individual situations. Some investment strategies and products not suitable for all investors. Consult qualified financial advisors, certified financial planners, or investment professionals for personalized guidance matching individual circumstances, risk tolerance, goals, and time horizons before making investment decisions. Investment success requires sustained discipline, appropriate risk management, and long-term commitment beyond basic knowledge. Advertisements or sponsored content may appear within or alongside this content. All information presented independently for educational purposes only.